
Improving Healthcare Outcomes With Love

By Peter J. Pronovost, MD, PhD, FCCM
In 2019, a patient I will call Helen came to one of our emergency departments with heart failure. She was sixty-four. It was her fourteenth visit for the same symptoms, and, like most hospitals in the country, we had treated each of the previous thirteen as a separate event—fluids, blood pressure brought down, discharge when she was well enough to go home, a follow-up appointment dutifully booked. This time the treatment did not take. Helen spent forty-eight hours in the cardiology unit fighting for her life.
The Illuminators is a reader-supported publication. To receive new posts and support my work, consider becoming a free or paid subscriber.
Only then did anyone on the hospital staff learn what her life was like. She was working full-time and raising her disabled granddaughter alone; her daughter had died of an overdose a few months earlier. She skipped checkups because no one could cover for her at work, and she was paying down hundreds of thousands of dollars in medical debt out of her retirement savings. The hospital, meanwhile, was losing millions giving her treatments that could have been prevented.
Helen’s blood pressure was not really a medical problem. It was the result of circumstances no one at the hospital had thought to ask about. By every conventional standard she had received excellent care—but no one was responsible for helping her live. Helen never knew to ask for the support she needed, we never thought to offer.
Five years later, a patient I will call Rose—also sixty-four, also living with heart failure—was in the care of the same hospital system. But Rose is rarely in a hospital, because she does not need to be. A primary-care team keeps up with her: a physician, nurse, and care manager coordinate her treatment; a social worker treats the anxiety that drives up her blood pressure; a pharmacist makes sure she can afford her medications; a wellness coach advises her on eating and sleeping; and if two months pass without anyone seeing her, an alert pings her phone.
The hero of Rose’s care is not any single healthcare professional. It is the system of relationships we built with her. By conventional standards it looks absurdly attentive, like an expensive concierge service—yet it costs about $9,400 a year, less than Medicare spends on the average patient her age, and a fraction of what a single hospitalization would cost. This type of relational care is better for everyone: for the patient, the physician, the hospital staff, the hospital budget, and especially for the larger community.
University Hospitals is an organization comprising 15 hospitals in Northern Ohio, headquartered in Cleveland. For the past four years, UH has also been a kind of laboratory of healthcare system change, with more than 400 ongoing projects, all aligned under the name, “Living and Leading with Love.” These programs are organized by hundreds of people throughout our system, in all specialties and in all our locations, often by people at relatively junior levels of the hierarchy. They have made all the difference for patients like Rose—and for the financial solvency of the healthcare system.
What we’ve learned at UH could be true for all healthcare. The most powerful interventions we have found require no special drugs, treatments, or equipment. They add no cost, and have been available since the dawn of humanity. We use one word to describe what makes them work: love.
Our definition of love is precise: the disciplined commitment to treat every human being as worthy and capable and to build systems that help them experience this. When we do this consistently, we generate remarkable results—in patient safety and well-being, quality of care, staff engagement, and financial benefit for hospitals and patients. Our ability to do this continues to accelerate, because all these factors reinforce one another. The gains add up to more than most people expect. It’s almost as if these acts of love, especially in institutional settings like hospitals, are wildly contagious; they inspire people to do more.
Since 2021, Medicare costs per patient at UH have fallen from above the national average to 33 percent below it. The system moved from $211 million in annual operating losses to financial stability. If similar practices were adopted nationwide, we estimate that total Medicare costs could drop by hundreds of billions of dollars annually.
We are often asked to catalog our results. This is the first of many articles in this series on what we have accomplished—and more importantly, on the changes in attitude and practice that led us to these results. Some of the results may seem unlikely, but they are all evidence-based. They have been produced by dedicated people in the healthcare professions who stopped treating harm as inevitable, who worked together across the departmental walls that usually divide them, and who built the structures—shared goals, transparent data, honest accountability—that make doing the right thing a habit rather than an act of courage.
Reducing Length of Stay
One of the most telling indicators of a hospital’s effectiveness is the average length of stay (LoS): the days that an acute care patient spends recovering in a hospital or skilled nursing facility rather than at home. Shorter stays generally mean better care and more rapid recovery. Reducing LoS also helps hospitals, which are paid the same by most insurers and by Medicare regardless of how long the patients stay in the hospital. It also helps the community by increasing the number of hospital beds available for incoming patients who may need them.
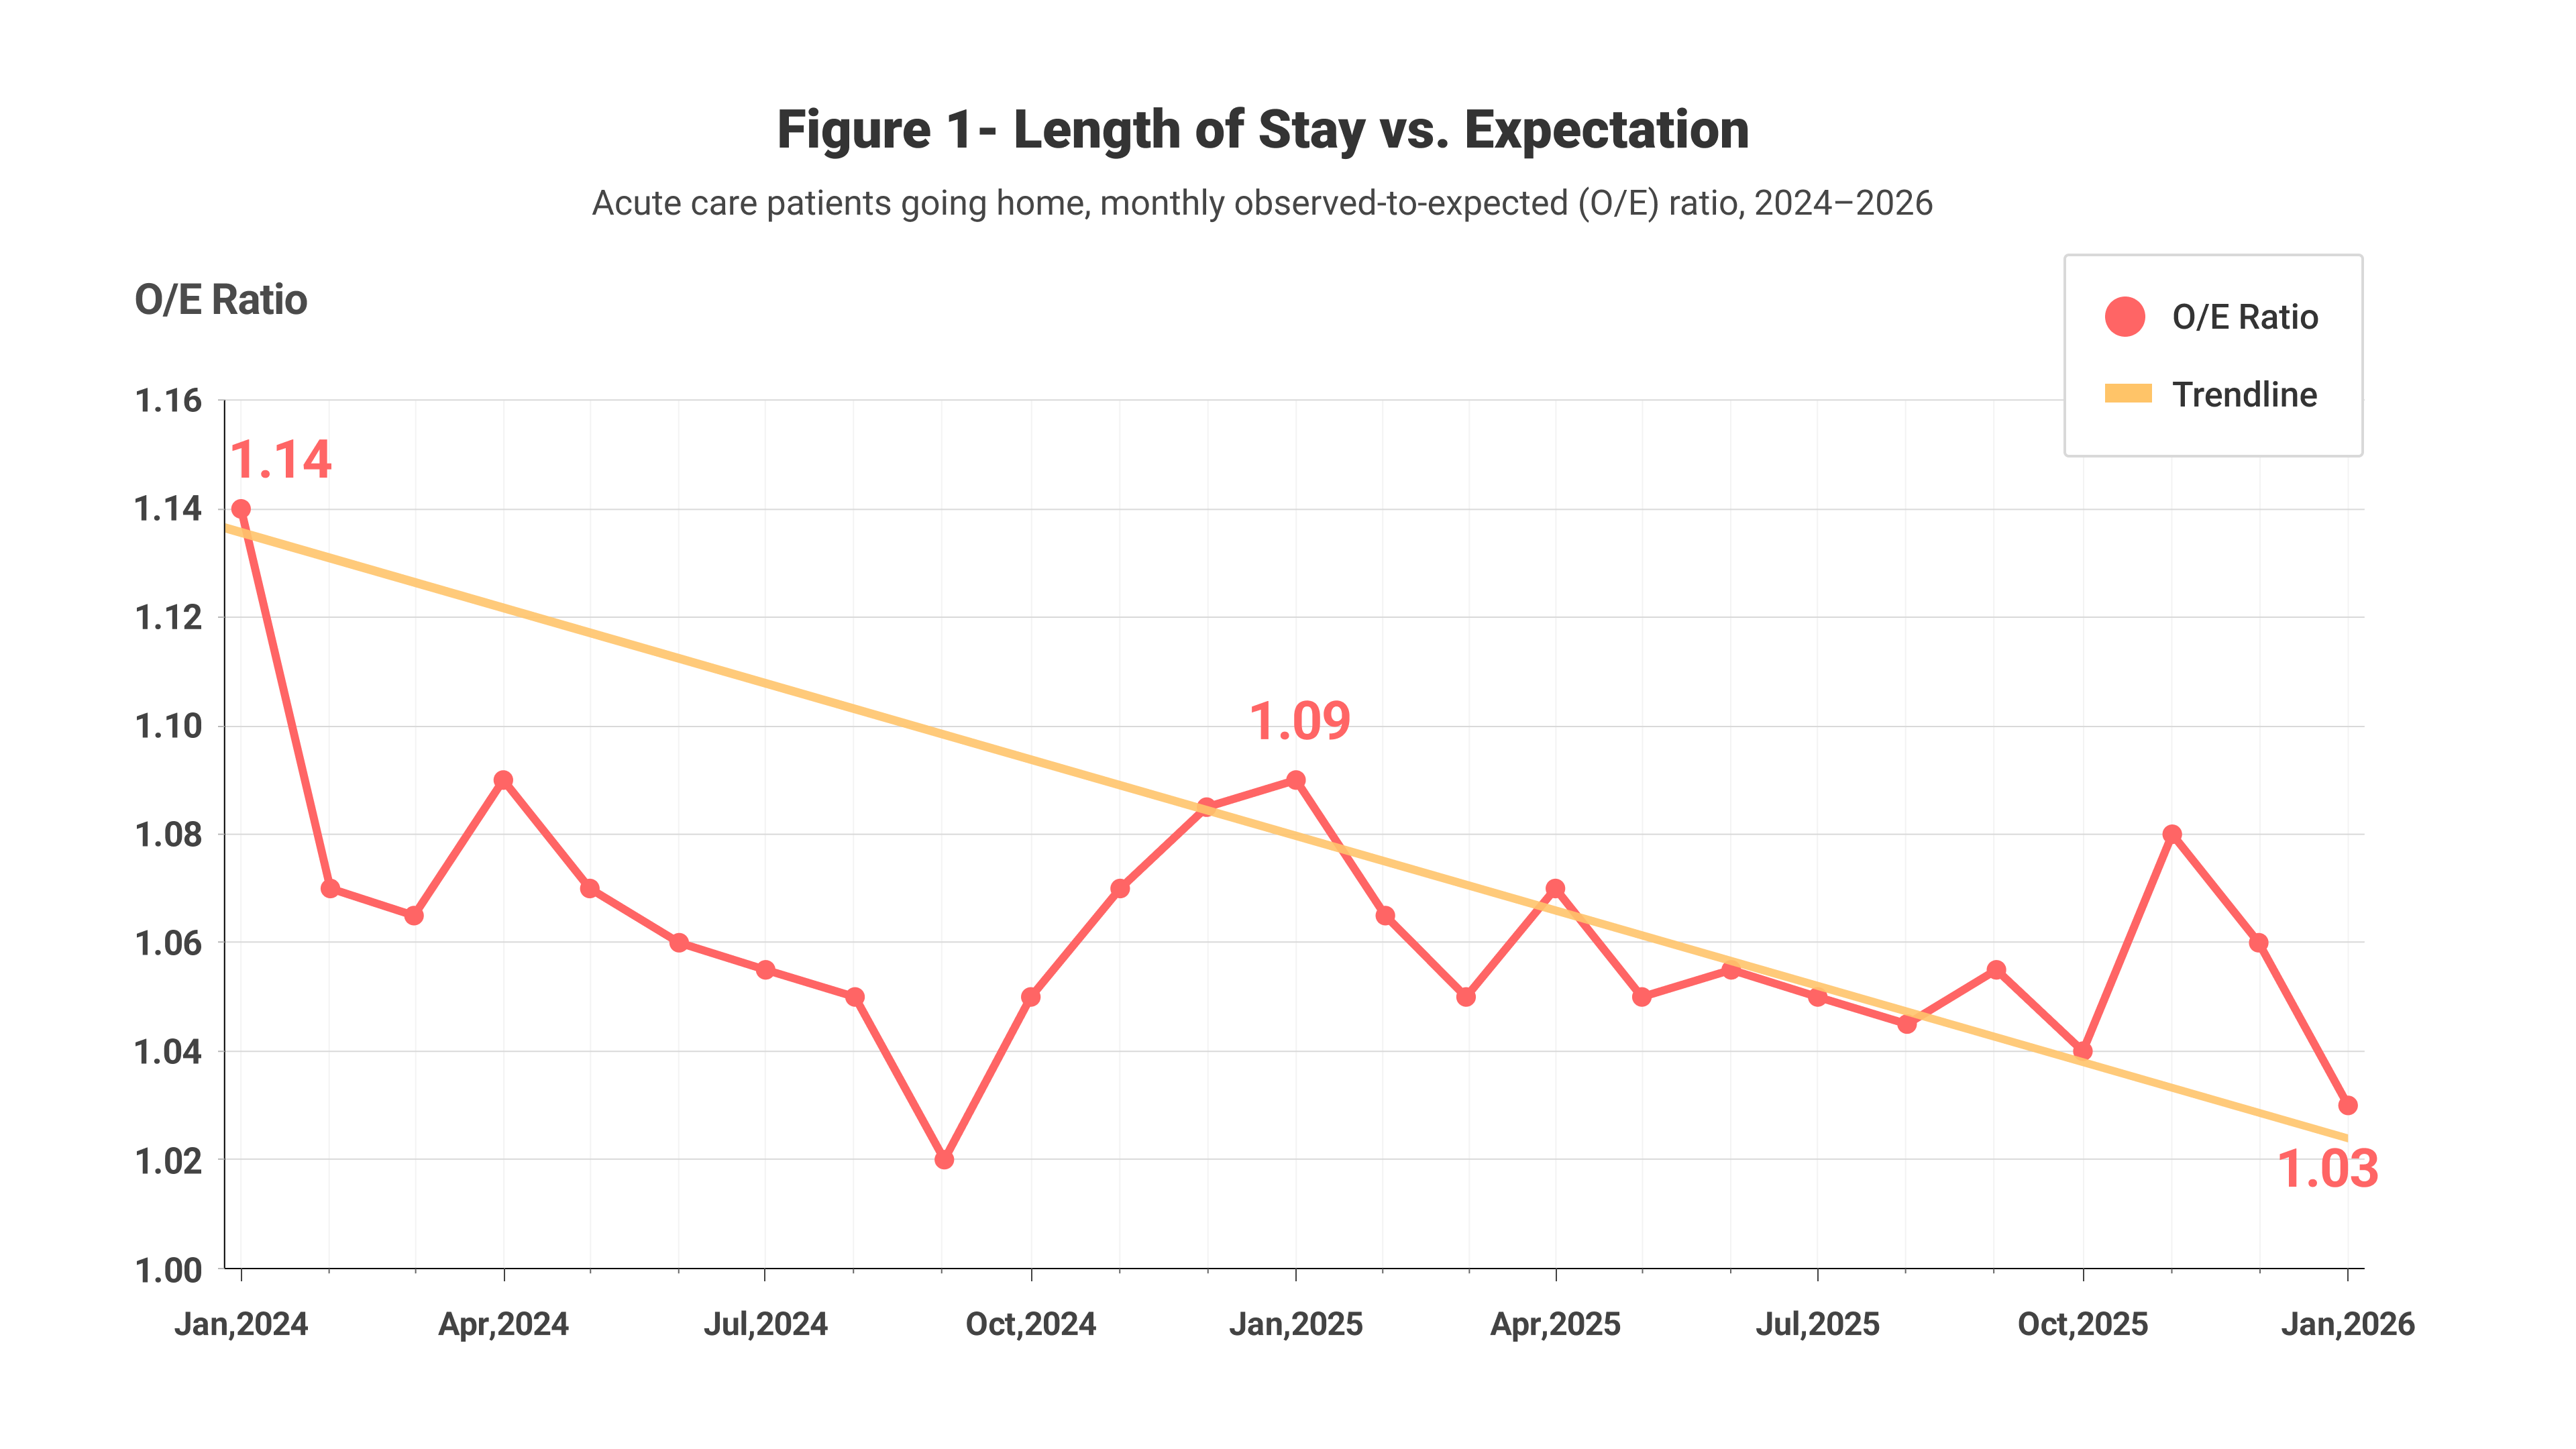
We have worked hard at UH to reduce LoS for acute-care inpatients: people recovering from surgery, intensive treatment, accidents, and other trauma. The most meaningful LoS metric for patient health is not the average amount of time spent at the hospital per se, but the amount of time compared to the estimate that a physician makes when admitting a patient. Back in 2022, our patients were staying about 30 percent longer than expected, at a cost of tens of millions of dollars a year. That did not mean they got better treatment; all too often, they were waiting for procedures or therapies that, for various structural or bureaucratic reasons, weren’t immediately available. Sometimes, this meant they were simply waiting for the hospital’s attention.
By 2024, our average LoS had gone down to about 14 percent over expectations, and today, as shown in Figure 1, it is less than 1 percent over expectations, and continuing to decrease.
Reducing Incidents of Sepsis
Sepsis is the body’s extreme response to infection—a cascade in which the immune system turns against the patient’s own organs. In principle, the treatment is straightforward. In its early stages, sepsis is harder to recognize than a heart attack or a stroke, because its symptoms vary with the patient and the infection. And we don’t have long to reverse the damage. Minutes matter. If there’s any delay, the patient can die.
Sepsis kills roughly 350,000 Americans each year, more than twice as many as stroke. Many of the infections that trigger it begin in the hospital, which means they are theoretically within our power to prevent. In 2023, a cross-functional team at UH set out to change the realities of sepsis infection.
The cross-functional element was critical. Sepsis cannot be managed in a single department. It requires continuous handoffs between the emergency room, inpatient teams, the ICU, and hospitalists. When those handoffs fail, patients die. UH’s hospitals had been operating as separate entities, each with its own approach and culture. Now they had an emotional connection among them, which gave them a stronger incentive to function as one.
They also changed the way staff were trained. In training sessions devoted to preventing sepsis, staff members told their own stories of encounters with the disease—the losses they’d carried, the moments they’d done everything right and still watched someone die. That personal honesty made people more willing to question long-held assumptions about what was possible.
The team also appointed sepsis coordinators at every hospital. These individuals became the human links among units and hospitals, meeting regularly, sharing what was working, flagging what was not. For example, some units had assembled bedside kits—blood culture vials, antibiotics, the materials for an immediate sepsis response—that could be grabbed the moment sepsis was suspected. Surfacing and sharing these solutions and others became an ongoing source of success.
The program spread to 15 hospitals and generated more than 100 champions across the system. Between 2020 and 2025, we saved an estimated 1,011 lives. Sepsis mortality fell by 80 percent. We are on our way to zero harm from this disease.
We have had similar reductions in the number of catheter-associated urinary-tract infections (CAUTI), central-line-associated bloodstream infections (CLABSI), and infections involving flexible endoscopes, the reusable tubes with lights and cameras used to examine hollow organs and cavities. Today, every UH hospital meets its CAUTI target, and all but a few meet the target for central-line and endoscopy infections—numbers we would once have called aspirational.
Improving Preventive Care
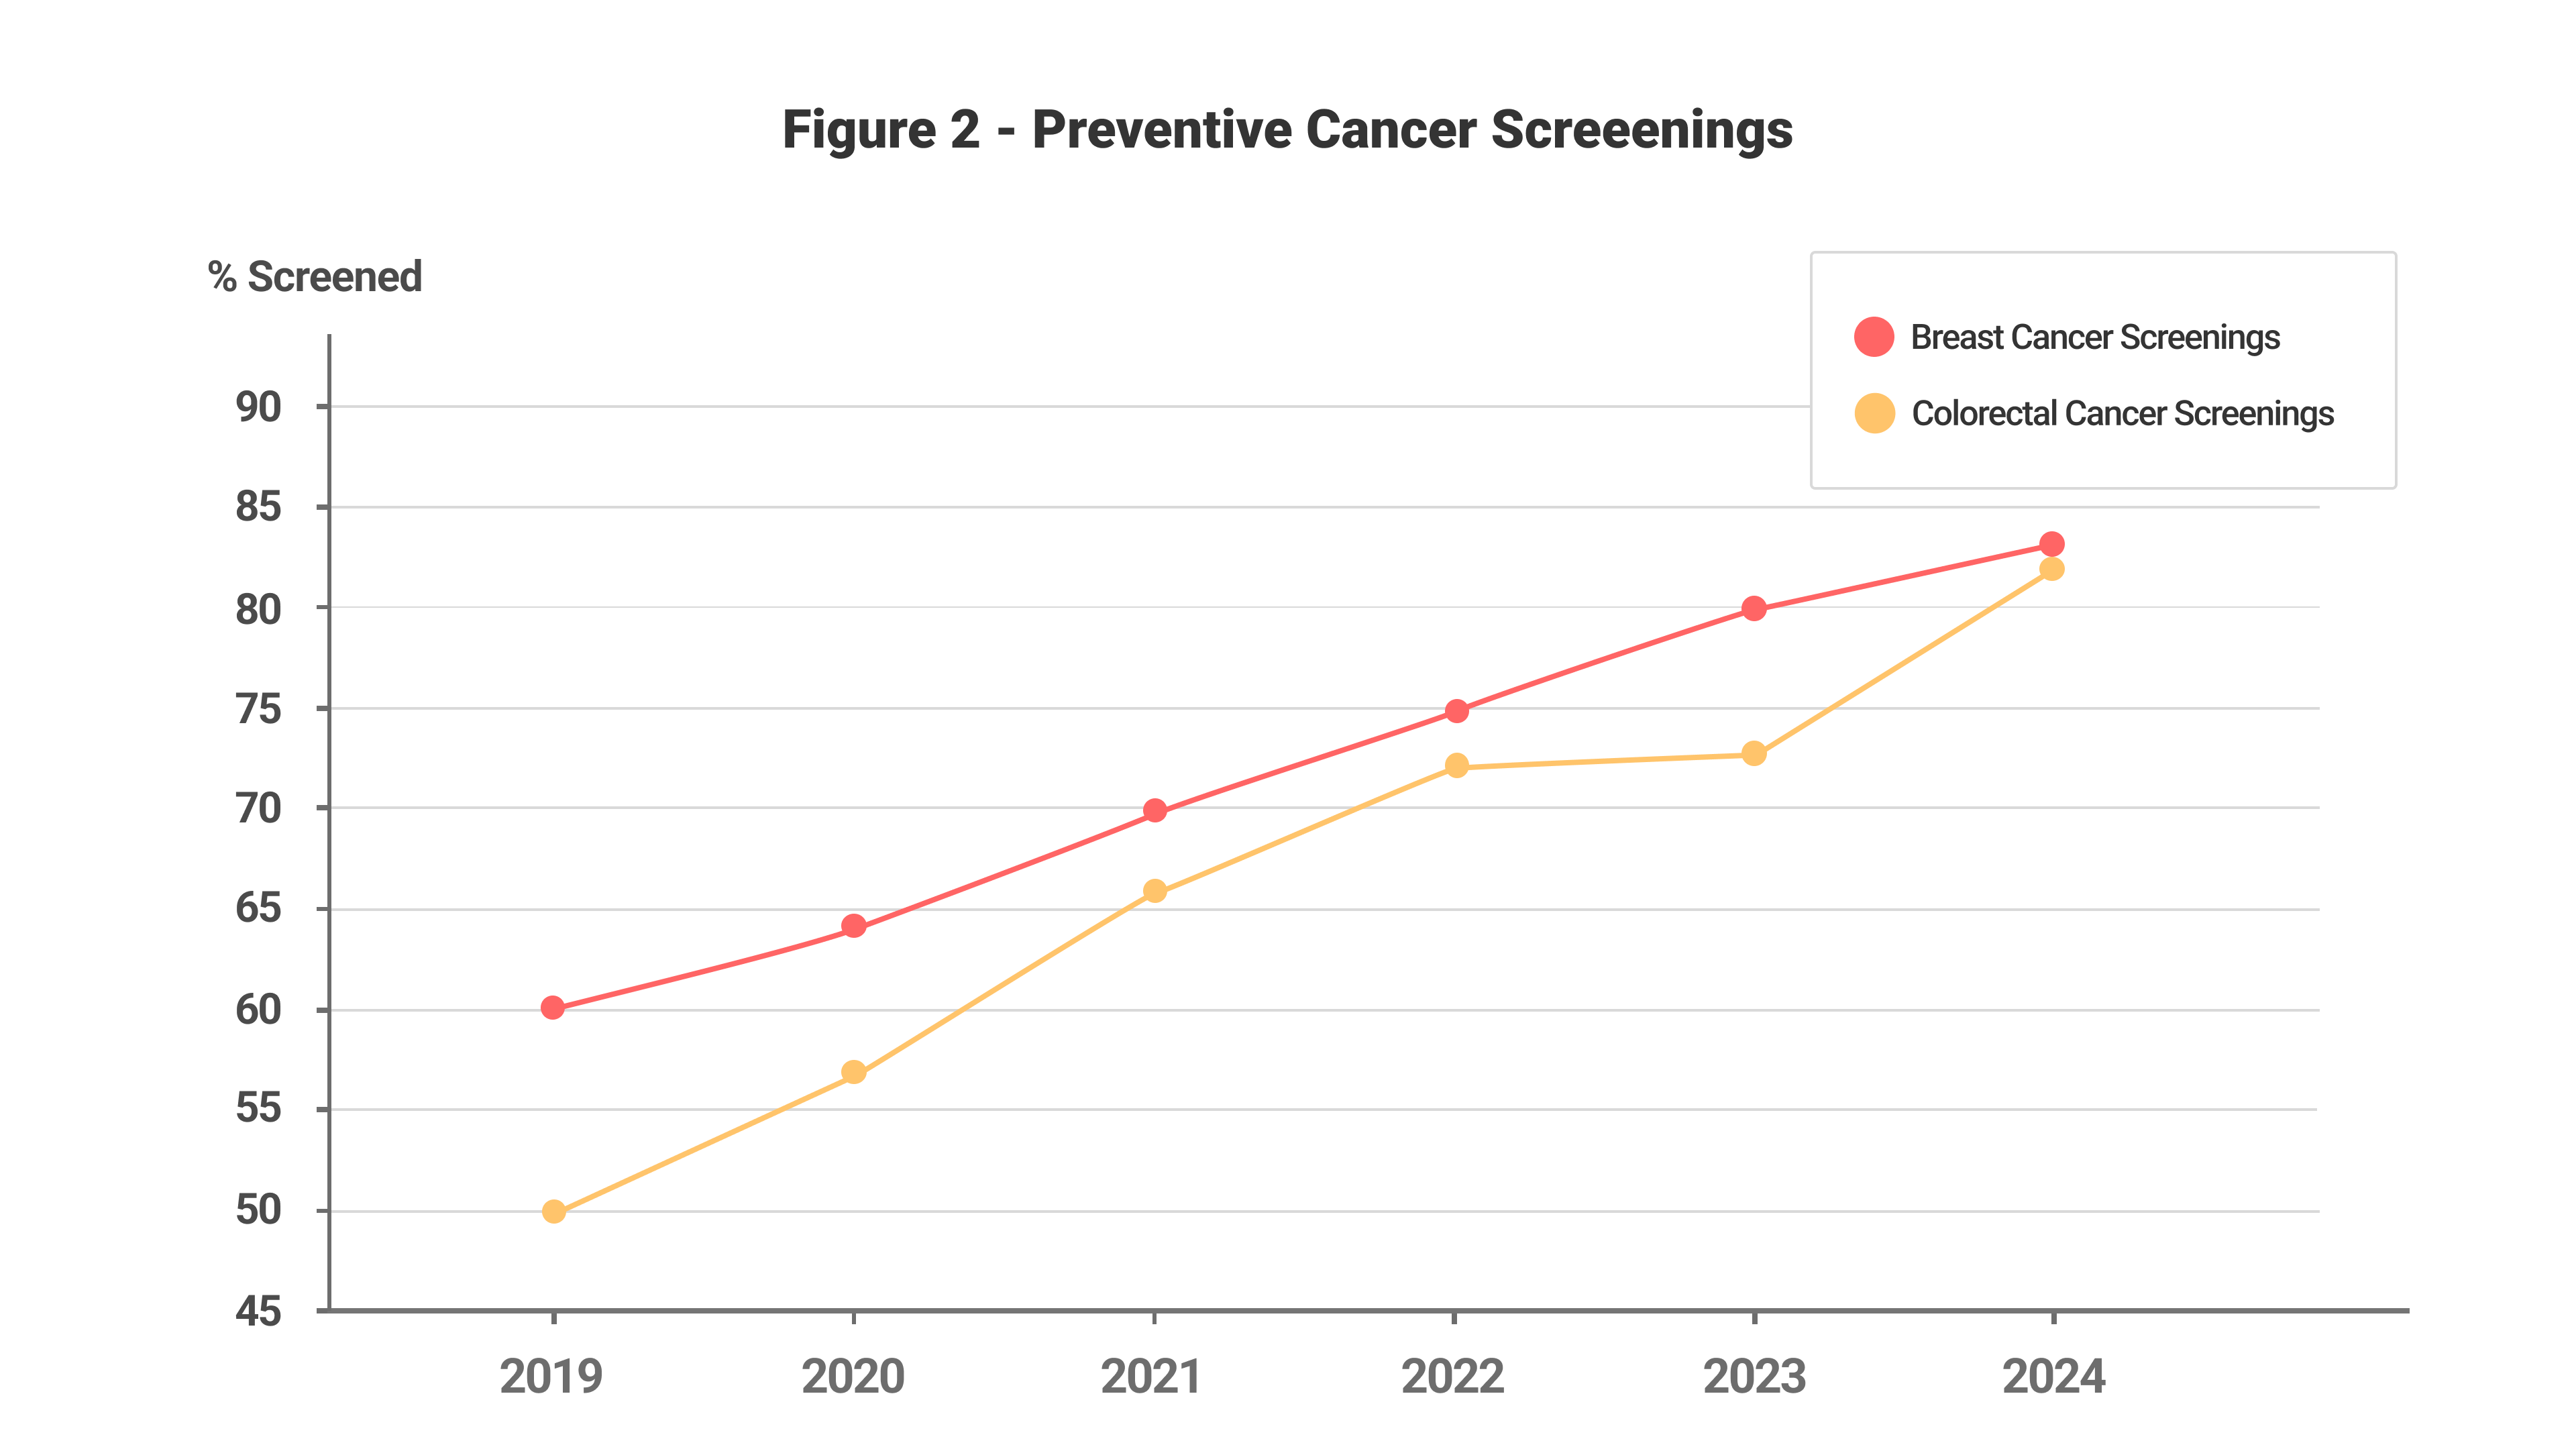
Most hospitals recognize the value of preventive care. For example, early screenings for colon cancer have helped reduce the number of deaths from this disease by about half since the mid-1970s. Similarly, post-treatment follow-up programs have a powerful track record in reducing hospital readmission rates.
Since we began tracking our cancer screening rates, the number of people receiving these diagnostics has increased dramatically. Figure 2 shows the rising share of our patients receiving cancer screenings in two important categories.
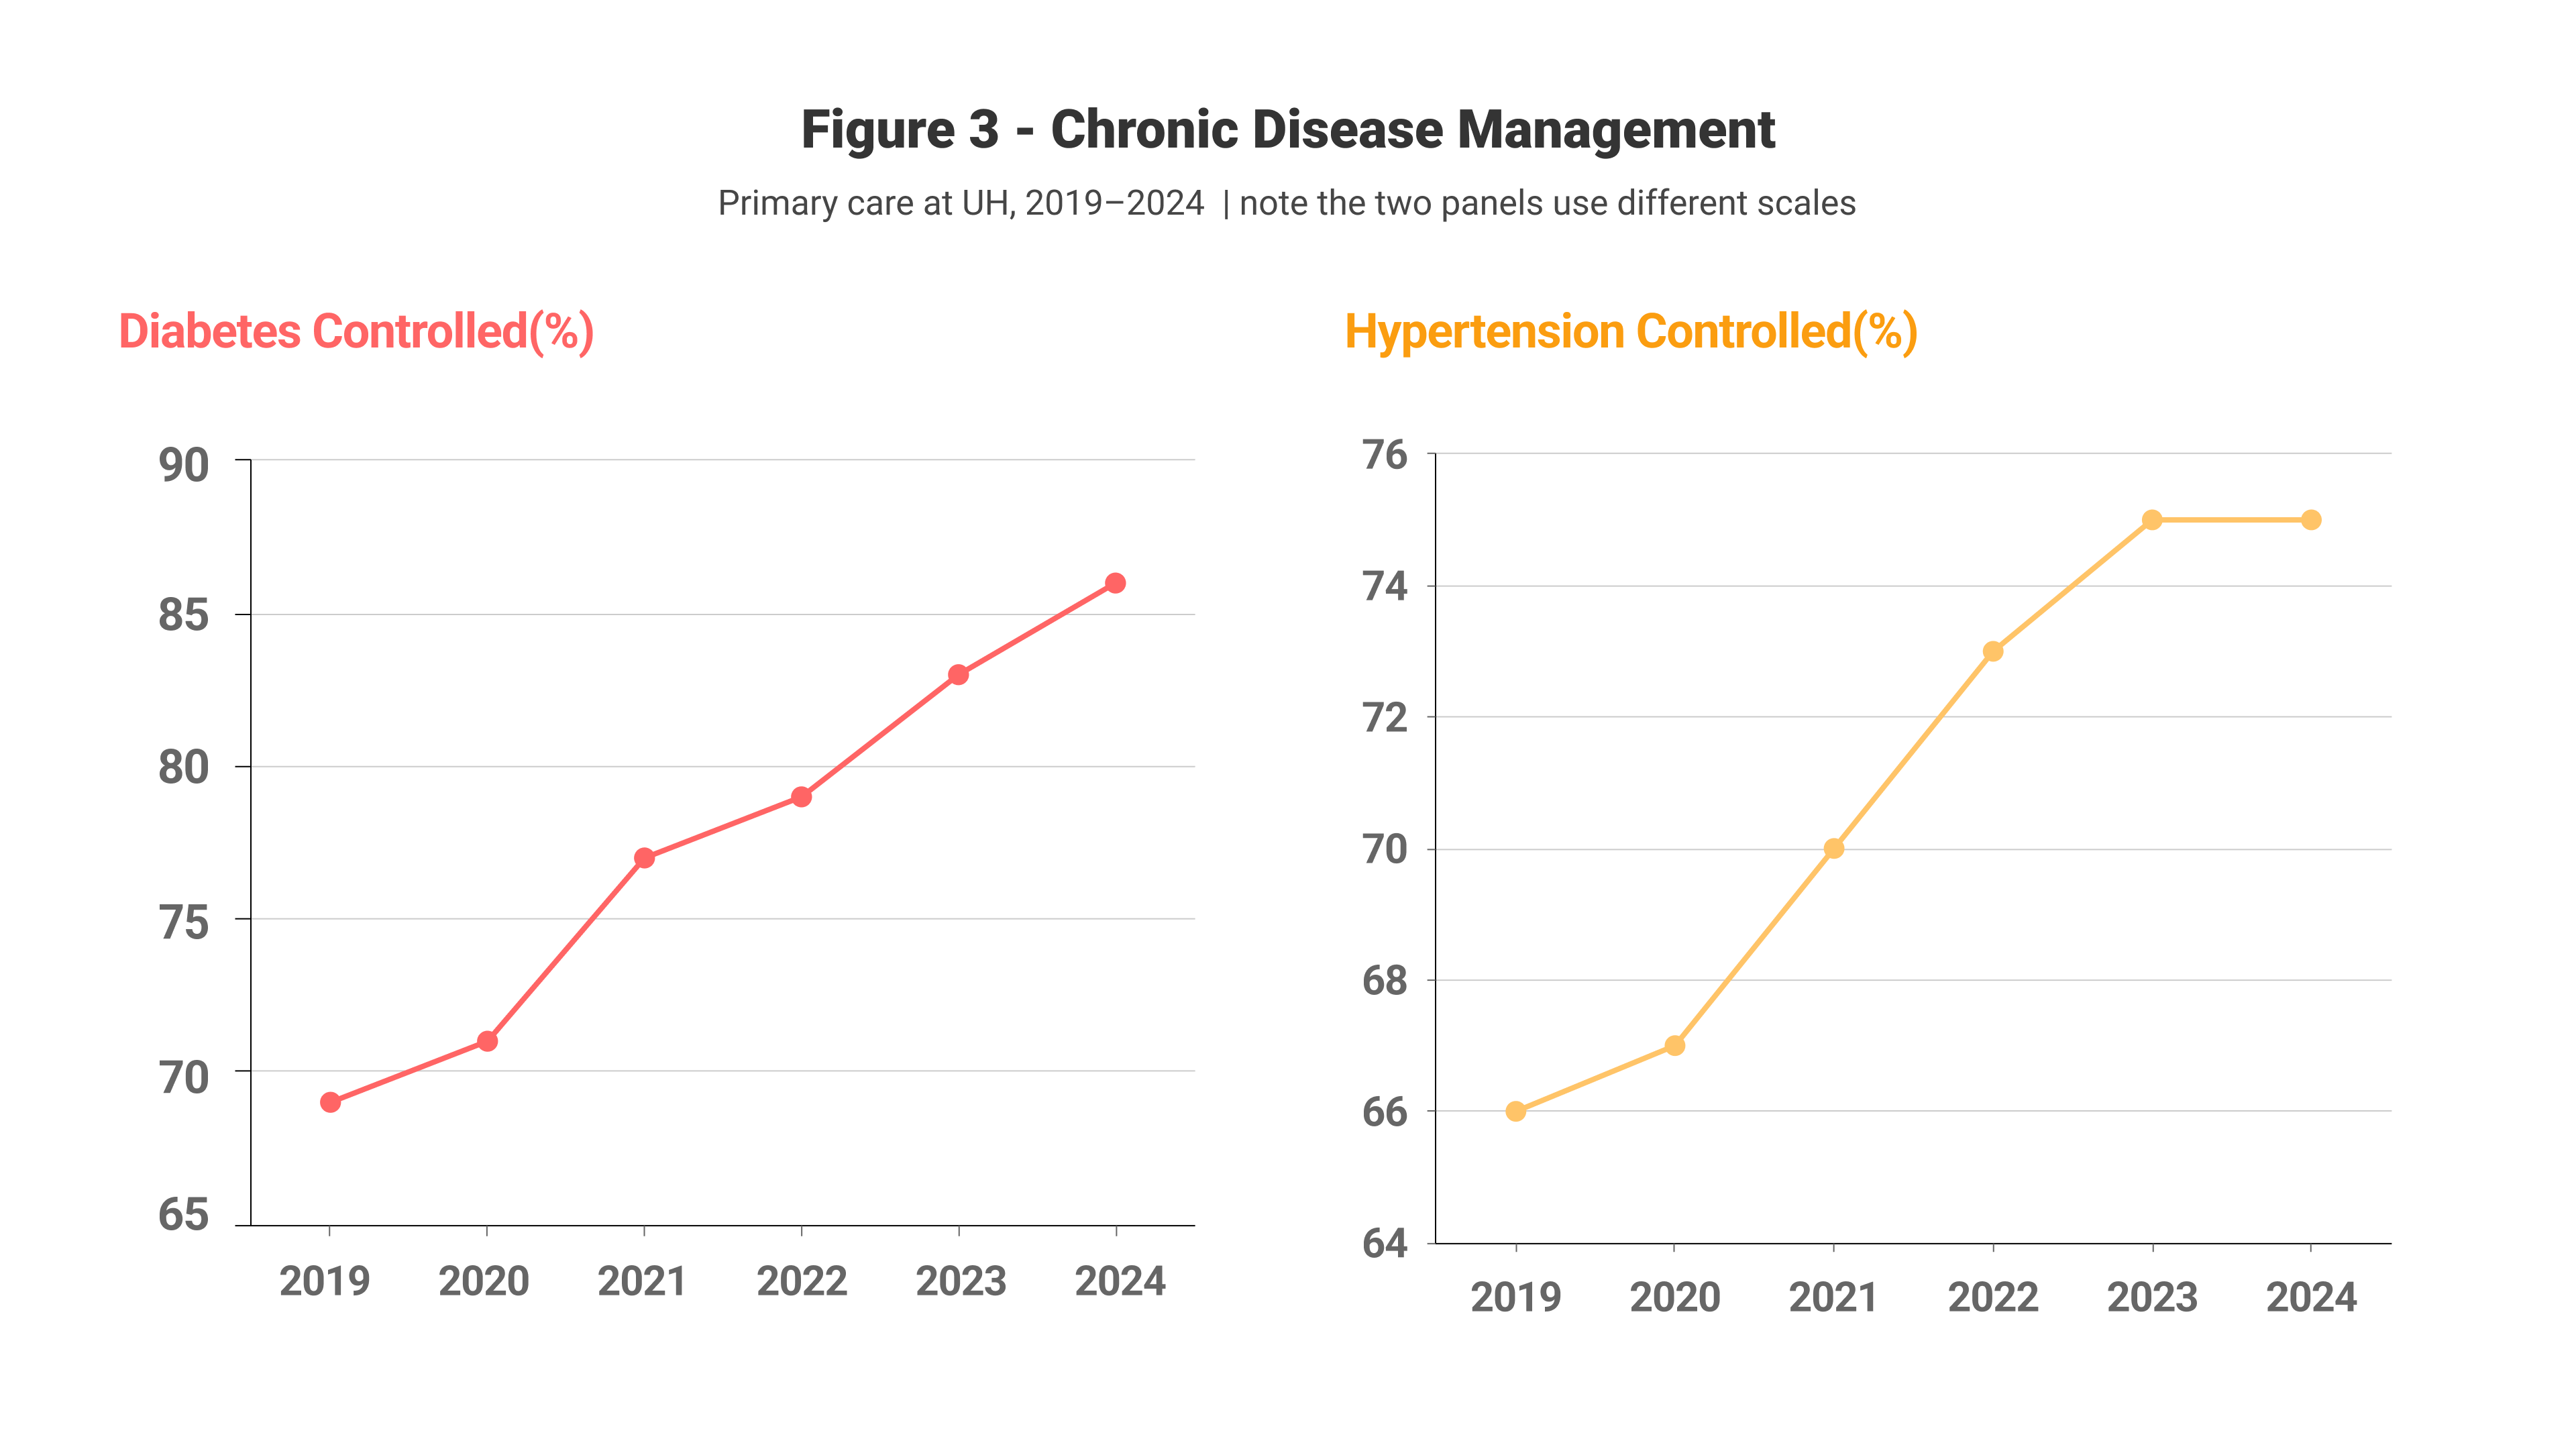
The management of chronic conditions like diabetes and hypertension has also improved. Here again, measuring the rate of improvement provides incentive and encouragement to the entire UH team. (See Figure 3.)
Patient Experience
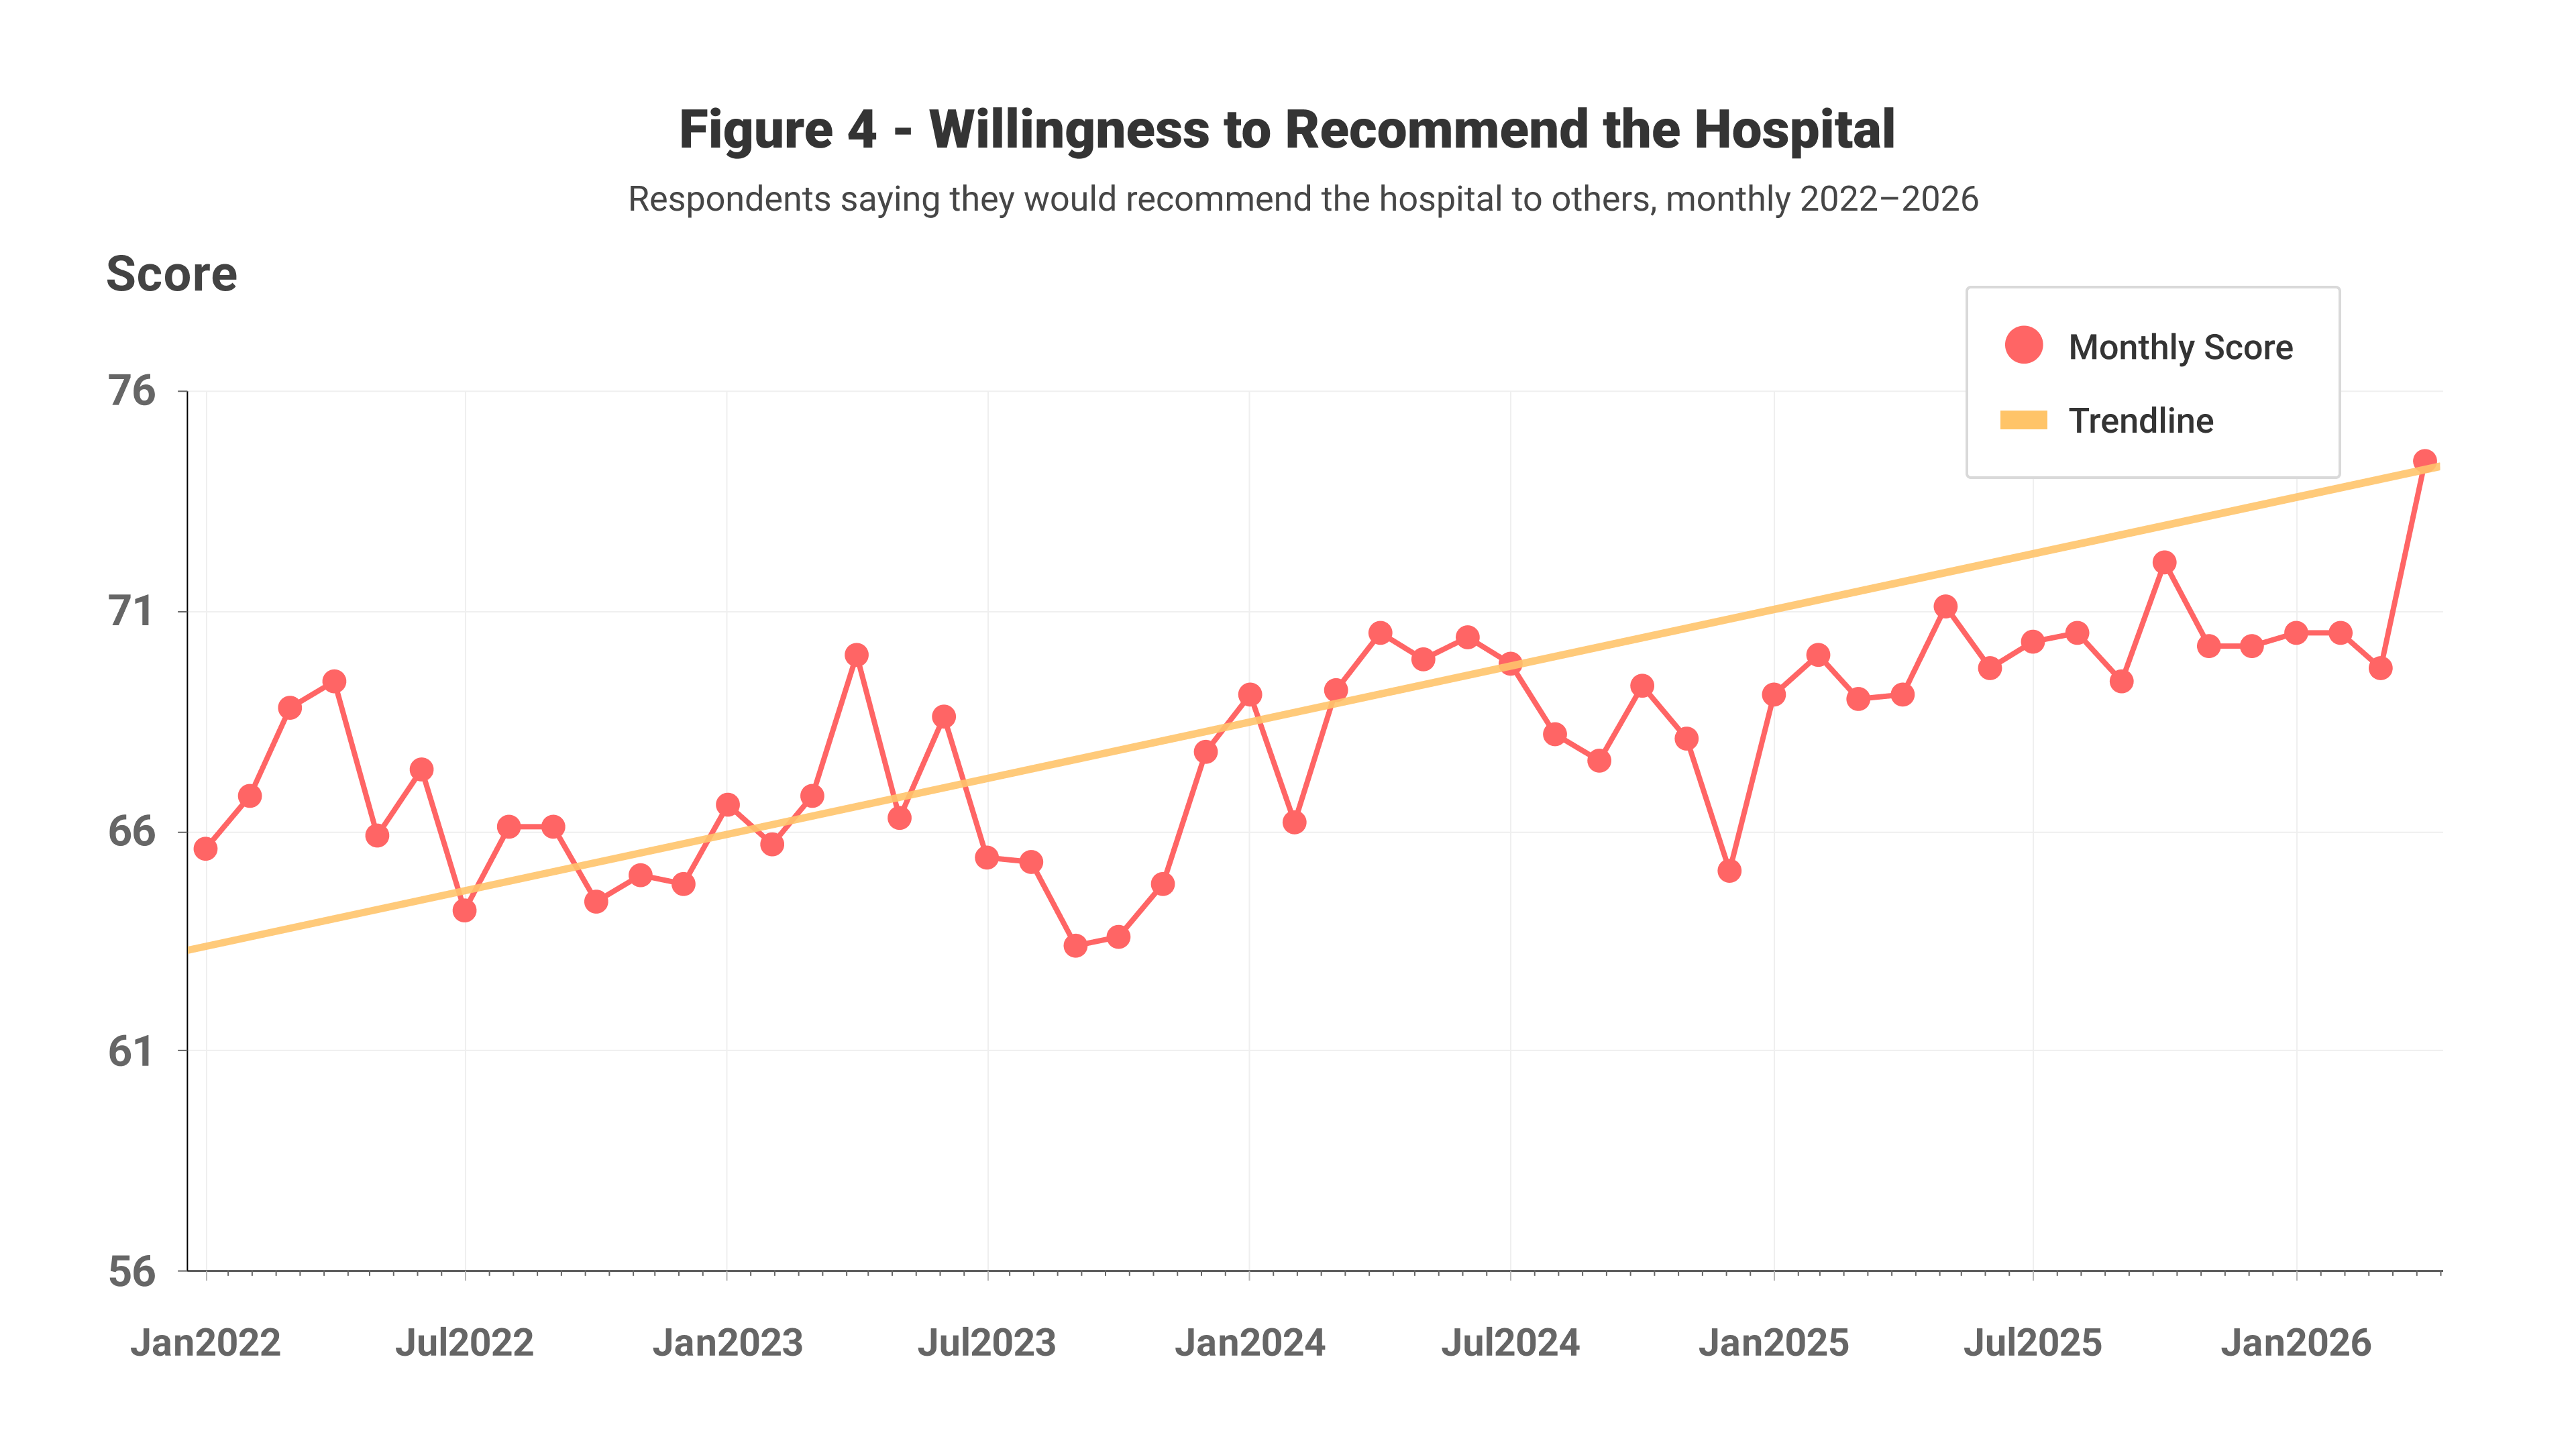
Do patients feel the difference our programs make? Our data indicate they do. All UH health systems are required to measure the patient experience using standard survey instruments established by the US Agency for Healthcare Research and Quality (AHRQ). The primary measure is a patient’s willingness to recommend the organization to others. Since applying Living and Leading with Love to the patient experience in 2022, the willingness of our patients to recommend the hospital, based on inpatient experience, has improved markedly, as shown in Figure 4. (Our scores on other AHRQ metrics, for treatment and outpatient care, also improved, but their baselines started higher, so the improvement was not as dramatic.)
Reducing Costs
Caring for people well and running a solvent hospital are not opposing goals; done right, each pays for the other. Over a five-year period, UH demonstrated that a hospital system can turn around its finances and deliver higher-quality care while reducing costs. We did this despite the grim reality that hospital costs are rising more than 5% per year, outpacing Medicare or Medicaid reimbursement rate changes.
In 2022, like roughly half the hospital systems in the country, UH was losing money: more than $200 million a year on operations. We turned around our practices, put our attention on cutting unnecessary expenses, and by 2025 our healthcare system broke even. This was earlier than projected, and our finances have kept improving since then. UH chief financial officer Bradley Bond estimates that our balance sheet swung about $750 million within the course of a few months in 2025—not because of any sudden miracle-like change, but because the cumulative effect of all our cost-saving practices became visible.
None of this came at the patients’ expense. As the balance sheet recovered, the quality numbers rose with it. Over three years, we took roughly a third out of the cost of caring for our Medicare patients. Our annual spending per Medicare patient fell from about $12,400 to about $8,200, while our quality scores went up.
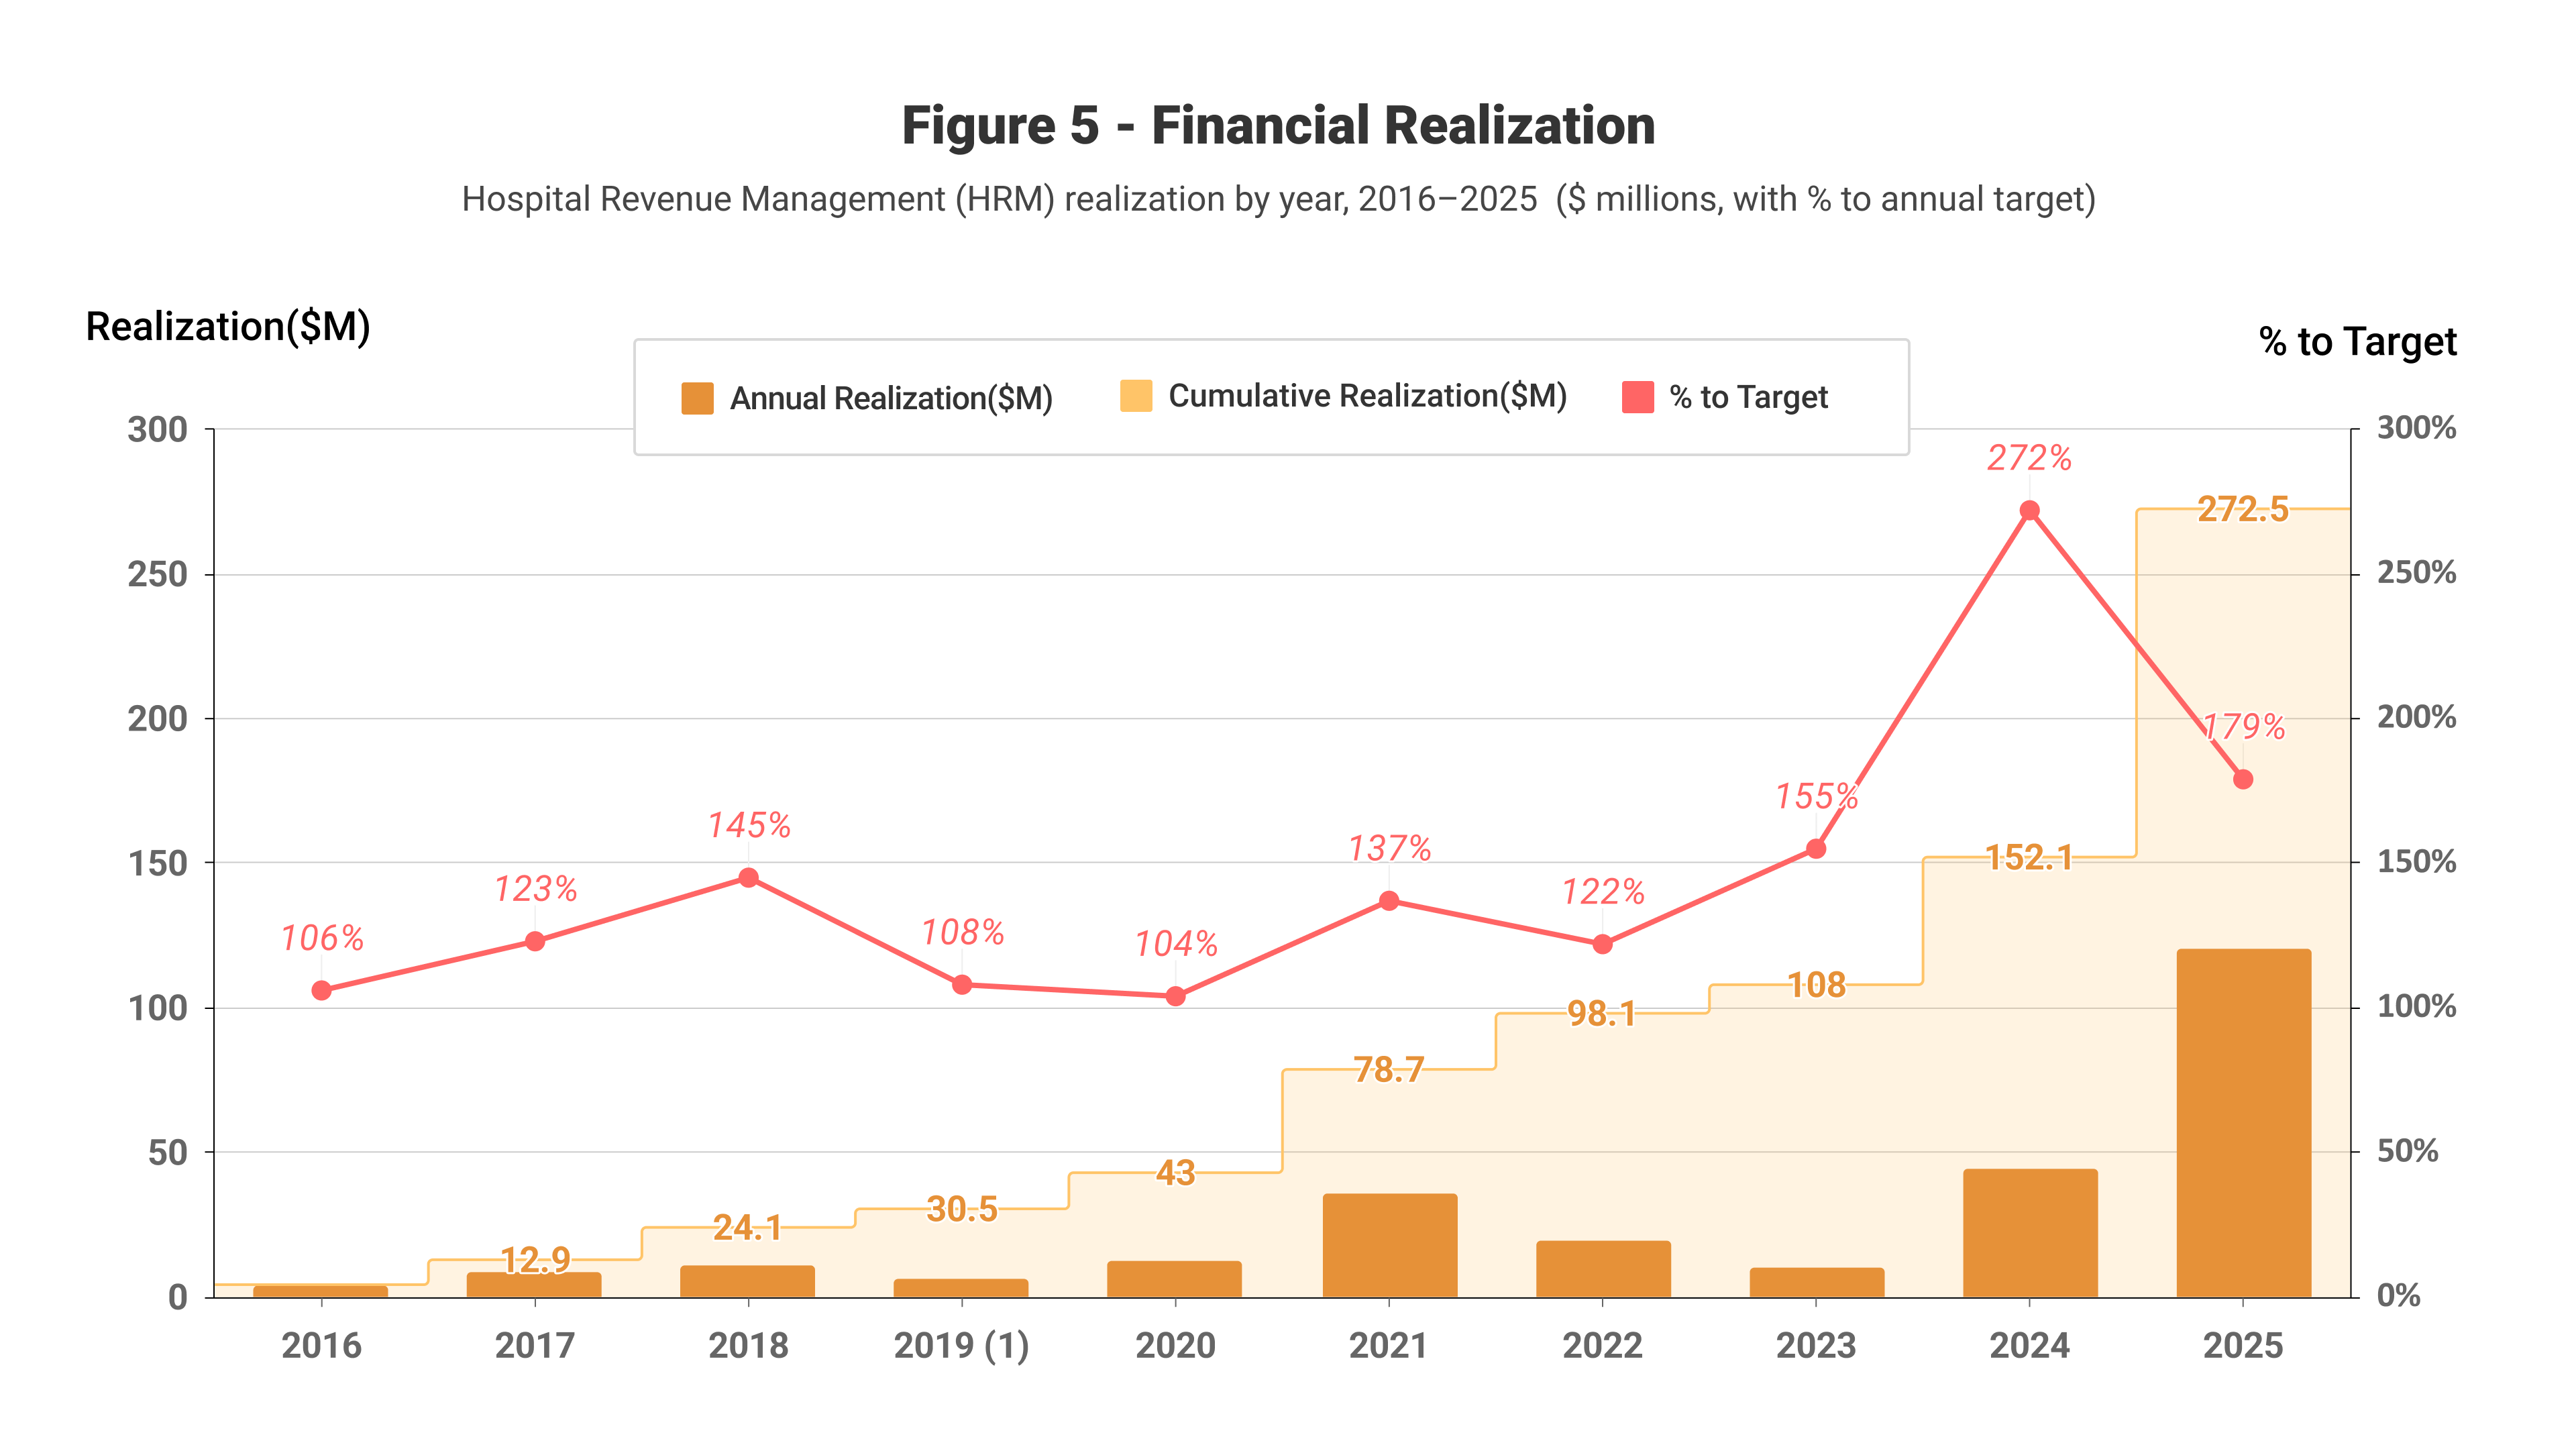
Figure 5 shows how the savings associated with healthcare improvement can accumulate. Each orange bar represents income that University Hospitals earned or saved in a single year through a set of improvement projects — getting patients home sooner, getting more claims paid correctly the first time, documenting care more accurately. The tan shaded area is the running total — every year’s value stacked on top of all the years before it. The line shows what we saved compared to our targets.
For most of the last decade the annual savings figure stayed modest, in the range of a few million to the mid-thirties. Then it surged: about $44 million captured in 2024, and roughly $120 million in 2025 — more in that one year than in any earlier year, by a wide margin. Added together, the projects have captured about $272 million since 2016. All of these gains came from the same operational improvements that the Living and Leading with Love culture is designed to enable.
The Methods Behind the Outcomes
We did not get to any of these results with a single intervention. We got there because thousands of people around UH decided, often in collaboration, that making these changes was possible, and worth their time and effort. A metric does not move when a committee approves a policy. It moves when a nurse on a night shift notices that a discharge order never reached the chart, when a physician advisor spends forty minutes on the phone with an insurer, when a hospitalist names the day a patient is likely to go home and the whole team treats that date as a commitment.
Our practice improvements take place across the whole system and within individual units. The 400 projects are organized by teams close to the work, either in a particular hospital or in a professional specialization. To reduce length of stay, for example, teams have worked together to redesign the flow of work. At Cleveland Medical Center, our largest facility, the schedule includes a 9 a.m. huddle every day where hospitalists name each patient’s estimated date of discharge and account for any that have slipped, a noon length-of-stay call every Tuesday and Thursday, and a 2 p.m. huddle with families, so the people who know the patient best are in the room when decisions are made, and the paperwork can be done before the end of the day. At Portage Hospital, an hour’s drive southeast, leaders assigned a nurse to manage throughput: working the floor from 10 to 6, chasing the small failures that strand patients such as a transport that never arrives, or a missing physician’s order.
Sustaining these gains has demanded real operational and cultural change. We hold ourselves accountable for better outcomes, but we do not blame people when there are problems. Instead, we look for ways to approach them together. There aren’t a few people dictating changes; there are hundreds exploring ways to improve. Whenever we feel locked into the old approach, we remind ourselves that the data shows the difference it makes.
At the heart of the change is a shift in attitude. People will often say something like this: “I used to think infections were inevitable and I was just powerless. I didn’t think I had the power to change anything. Now I realize they are preventable, and I can do something about it.” The person saying this could be a nurse, an ICU attending physician, an infectious disease specialist, a quality leader, or a member of the administrative staff. If we could change that mental model on a larger scale, we could not just solve individual problems; we could transform healthcare across our society.
Other healthcare systems are also using metrics to think differently about costs and quality. In Maine, employers frustrated with rising premiums are sitting down with hospitals to design alternative payment models. In California, integrated systems are taking full risk for defined populations, essentially becoming insurers themselves. Kaiser Permanente has been a consistent leader in this field from its early days. In Vermont, a consortium of healthcare institutions is launching an initiative modeled after Living and Leading with Love, in part to address the runaway increases in healthcare costs in that state.
For healthcare leaders, the message is clear: we don’t need to wait for perfect policy solutions. When an organization treats every person within it as worthy and capable, and builds the systems to prove it, better care and lower cost stop being a tradeoff. That is not an aspiration. It is substantiated by the evidence, in case after case. As this Substack newsletter evolves, we hope to provide ongoing examples and practice guides so that any healthcare system can replicate—or surpass—our results.
Notes
The Living and Leading with Love concept:
Peter Pronovost, “Living and Leading with Love: Transforming Healthcare through Mutual Respect and Accountability.” Innovations: Technology, Governance, Globalization 2025; 14 (1-2): 32–54. doi: https://doi.org/10.1162/INOV.a.270
Length of stay:
OECD, “Length of hospital stay,” OECD Health Indicators. https://www.oecd.org/en/data/indicators/length-of-hospital-stay.html
Hyunyoung Baek et al. (2018), “Analysis of length of hospital stay using electronic health records: A statistical and data mining approach,” PLOS ONE 13(4): e0195901. https://doi.org/10.1371/journal.pone.0195901
James W. Thomas, Kenneth L. Guire, and Gerald G. Horvat (1997), “Is patient length of stay related to quality of care?” Hospital & Health Services Administration 42(4): 489–507. PMID 10174462. (Use this as the basis for treating LoS as an efficiency rather than a quality measure.)
“Frailty and deconditioning on the acute take,” Medicine / ScienceDirect (2025), on hospital-acquired deconditioning syndrome. https://www.sciencedirect.com/science/article/pii/S1470211825002660
Factors associated with prolonged length of stay in older patients, Singapore Medical Journal (2017). https://pmc.ncbi.nlm.nih.gov/articles/PMC5360868/ (prolonged stay raises hospital-acquired infection risk in older patients)
Peter J. Kaboli et al. (2012), “Associations Between Reduced Hospital Length of Stay and 30-Day Readmission Rate and Mortality: 14-Year Experience in 129 Veterans Affairs Hospitals,” Annals of Internal Medicine 157(12): 837–845. https://doi.org/10.7326/0003-4819-157-12-201212180-00003
Sepsis:
Centers for Disease Control and Prevention, “Sepsis Program Activities in Acute Care Hospitals—National Healthcare Safety Network, United States, 2022,” MMWR 72(34), 2023, reporting at least 1.7 million adult hospitalizations and at least 350,000 deaths annually. https://www.cdc.gov/mmwr/volumes/72/wr/mm7234a2.htm
Centers for Disease Control and Prevention, “CDC launches new effort aimed at strengthening survival and recovery rates for all sepsis patients” (August 24, 2023). https://www.cdc.gov/media/releases/2023/s0824-sepsis-patients.html
Colon-cancer mortality and screening:
American Cancer Society, Colorectal Cancer Facts & Figures 2023–2025 (Atlanta: American Cancer Society, 2023): the mortality rate fell roughly by half since the mid-1970s and continued to decline about 2 percent annually over the past decade, attributed in large part to screening. https://www.cancer.org/content/dam/cancer-org/research/cancer-facts-and-statistics/colorectal-cancer-facts-and-figures/colorectal-cancer-facts-and-figures-2023.pdf
Rebecca L. Siegel et al. (2023), “Colorectal cancer statistics, 2023,” CA: A Cancer Journal for Clinicians 73(3): 233–254, reporting a ~2 percent annual mortality decline from 2011–2020 overall but a 0.5–3 percent annual increase in adults under 50. https://doi.org/10.3322/caac.21772
Follow-up calls and transitional care:
Agency for Healthcare Research and Quality, PSNet, “Postdischarge Follow-Up Phone Call,” noting that phone calls alone have limited stand-alone evidence but are a component of nearly every successful transitions program. https://psnet.ahrq.gov/web-mm/postdischarge-follow-phone-call
Brian W. Jack et al. (2009), “A Reengineered Hospital Discharge Program to Decrease Rehospitalization: A Randomized Trial” (Project RED), Annals of Internal Medicine 150(3): 178–187. https://doi.org/10.7326/0003-4819-150-3-200902030-00007
Hospital costs and reimbursement:
American Hospital Association, The Cost of Caring (2024 and 2025 editions): total hospital expense grew 5.1 percent in 2024 against 2.9 percent general inflation; general inflation rose 12.4 percent from 2021–2023, more than double the 5.2 percent growth in Medicare inpatient reimbursement; Medicare paid about 83 cents per dollar of hospital cost. https://www.aha.org/costsofcaring
KFF (2026), “Hospital Spending Accounted for 40% of the Growth in National Health Spending Between 2022 and 2024”: hospital prices grew 2.7 percent in 2023 and 3.4 percent in 2024. https://www.kff.org/health-costs/hospital-spending-accounted-for-40-of-the-growth-in-national-health-spending-between-2022-and-2024/
Potential Medicare cost savings from emulating Living and Leading with Love:
UH internal Medicare cost-per-beneficiary data, 2021–2025, benchmarked against CMS national averages. The broader estimate is based upon extrapolation by the UH economics team, applying UH’s achieved Medicare cost reductions (2021–2025) to the national healthcare system. The projection assumes broad adoption of the framework and comparable cost-reduction trajectories. Full methodology is available on request.
The Illuminators is a reader-supported publication. To receive new posts and support my work, consider becoming a free or paid subscriber.