
Humanizing the Data in Healthcare
Peter Pronovost, MD, PhD
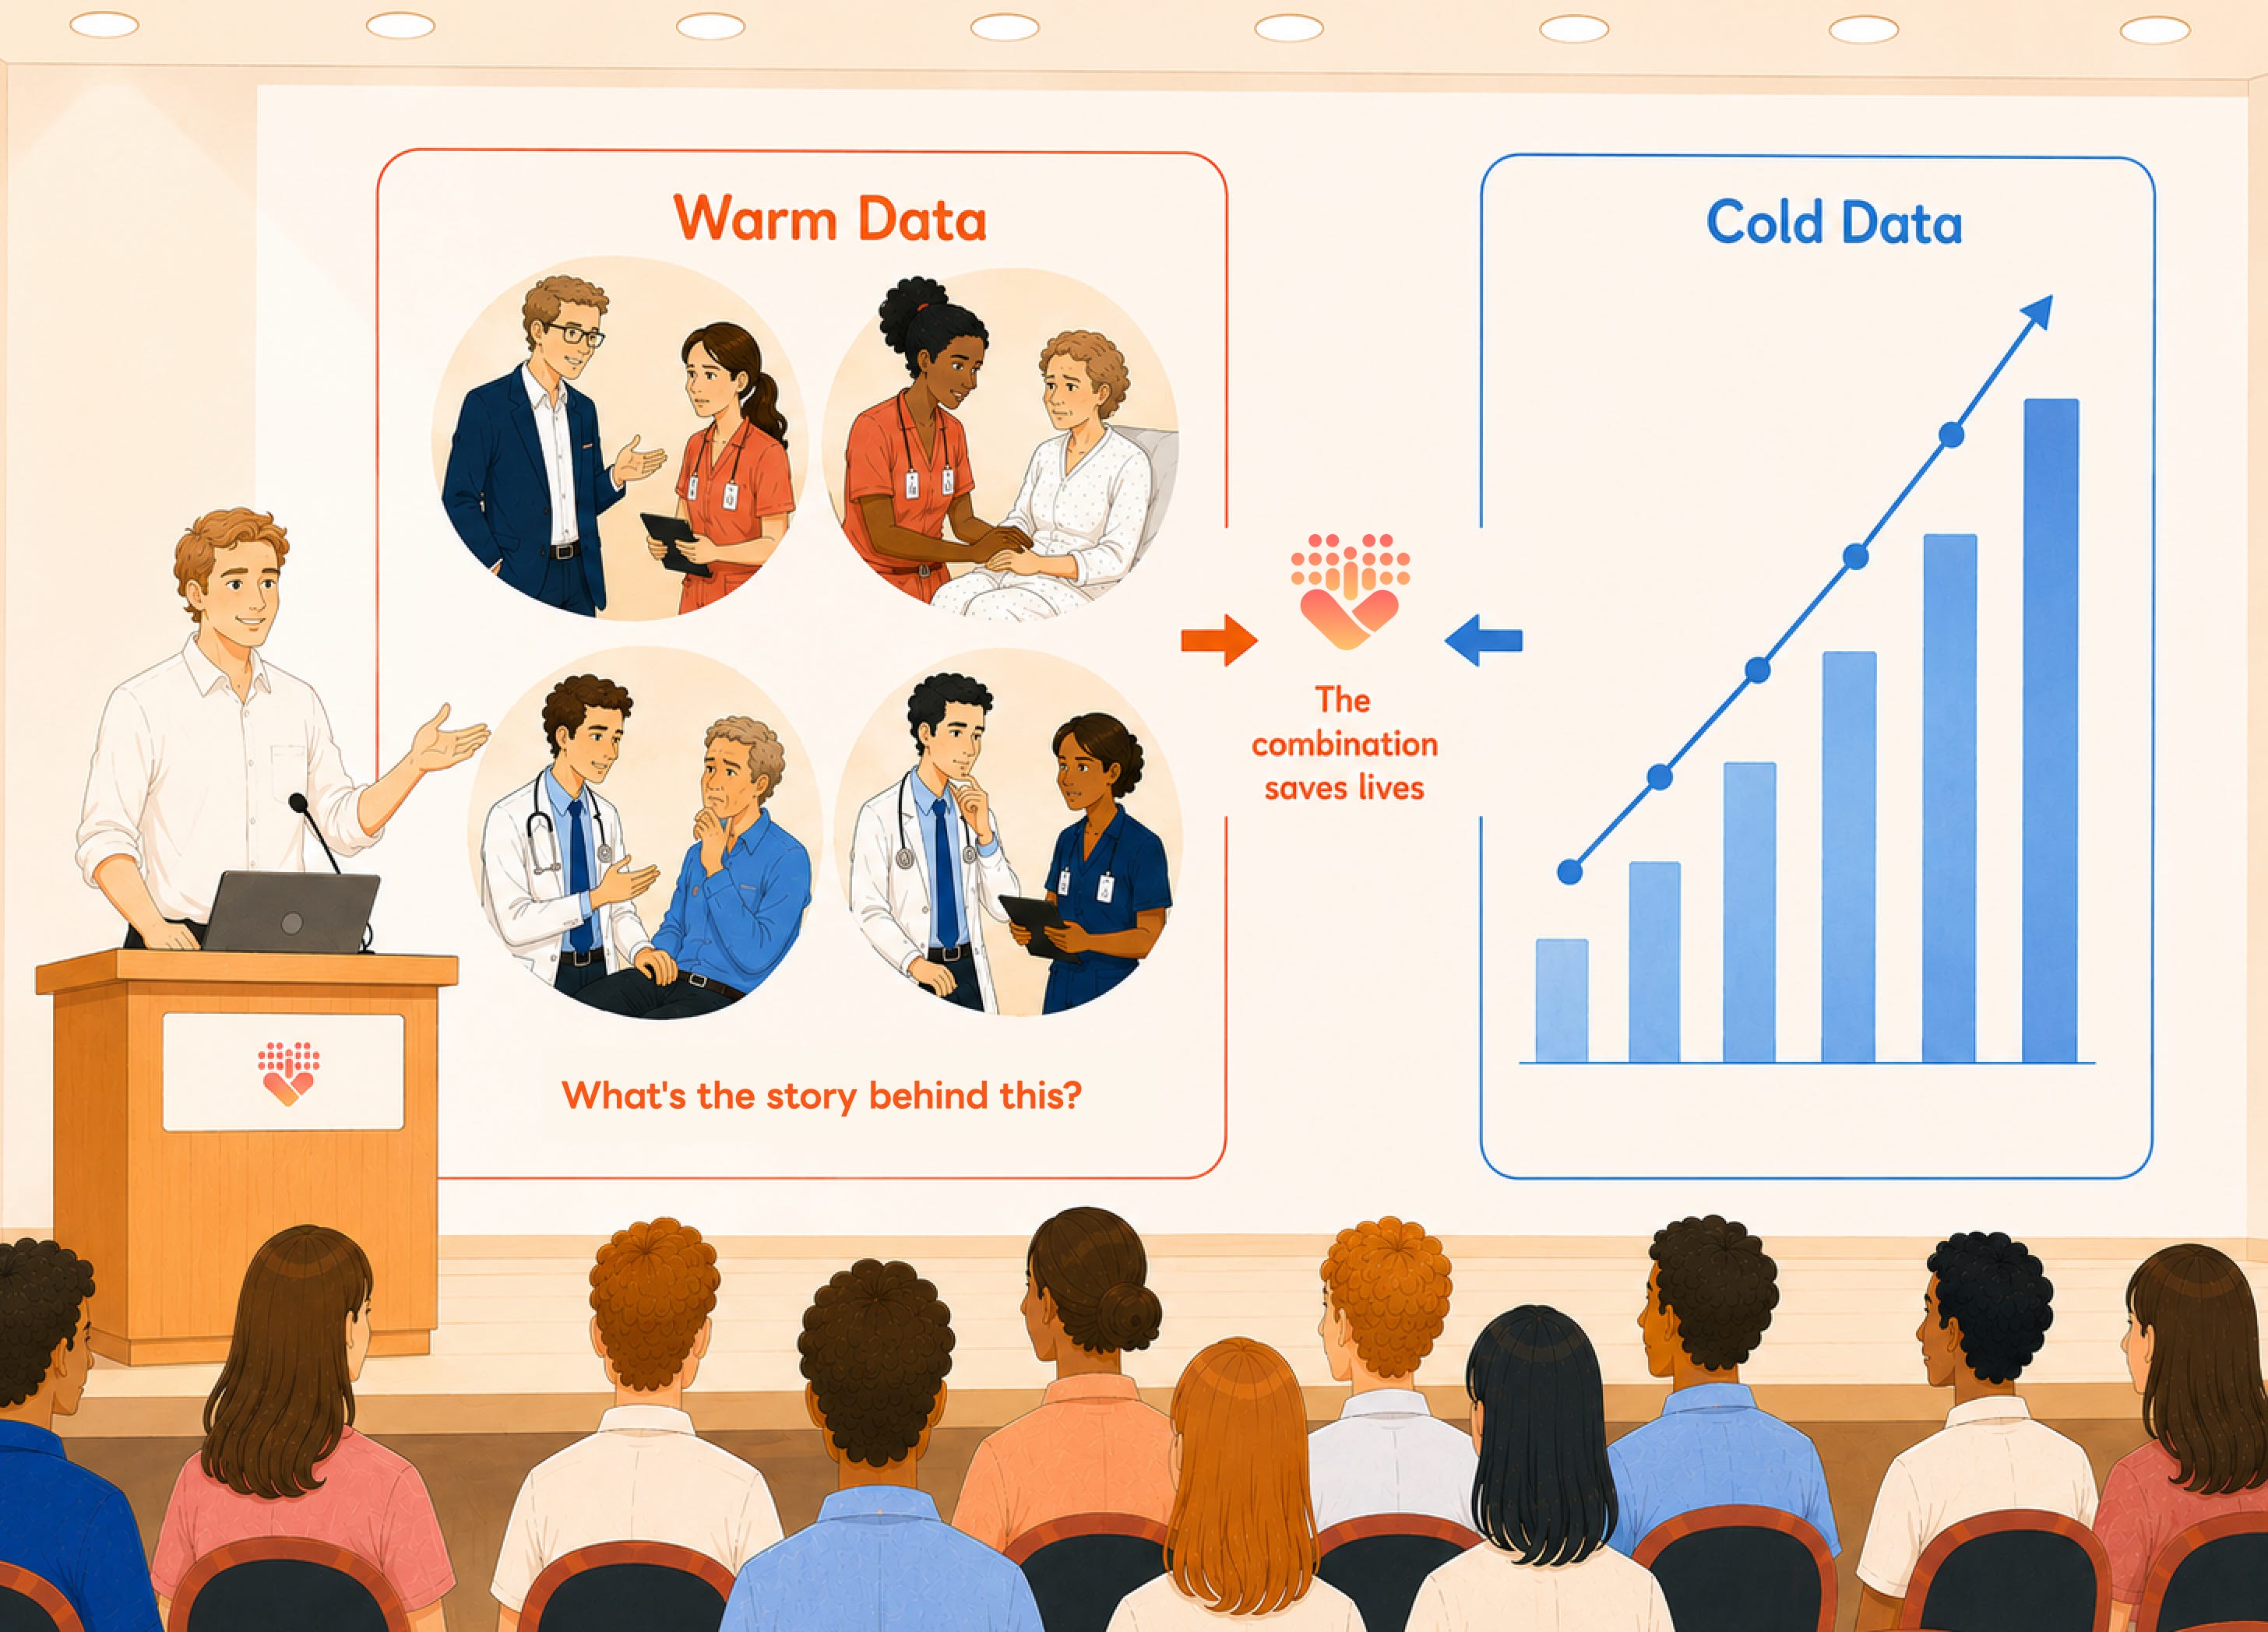
The test results showed dangerously high blood sugar levels, a major indicator for diabetes: A1C levels of 12, more than double the normal level. The patient was referred to a health plan’s diabetes program and began working with a hospital dietitian.
The Illuminators is a reader-supported publication. To receive new posts and support my work, consider becoming a free or paid subscriber.
From the beginning, the patient was suspicious: hesitant about the program, frustrated and angry in conversation, and adamant that she didn’t want any additional medications or changes. She said she preferred to rely on her own research. Her glucose sensor alarm went off constantly at work, so she stopped using the sensor. She said she had only 30 minutes during her lunch break for appointments, which could last up to an hour, and she had a habit of forgetting her insulin at home.
Hearing all this, the dietitian stopped focusing on the medical data. Instead, she started listening to the patient’s story: why it was so difficult to keep up with the medication, and how her work schedule had pressured her. Over time, they found solutions to each irritation. They held a three-way call with the pharmacy about refills. They arranged appointments with an endocrinologist whom she trusted. They found a way to get her sensor fixed so its alarms didn’t keep going off. As they worked through her story, her use of the medication improved. Her A1C levels went down from 12 to around 8.
We are beginning to recognize the importance of the patient’s story in relational care. To improve our practices in any significant way, we need to look past the metrics and consider each patient’s broader story: the financial pressures, the attitude issues, the family circumstances, whether their life issues as well as their health issues are recognized, and whether the care is having an effect on them.
These are factors that no blood test or screening instrument can detect, and yet they may make all the difference in promoting wellness—for the individual person and for society as a whole.
Warm and cold data
Nora Bateson, the systems researcher and filmmaker, distinguishes between “cold data” — quantitative, decontextualized, statistical — and “warm data,” which she defines as information about the interrelationships that integrate a complex system. Cold data describes the parts; warm data describes their interplay. Cold data tells you what happened. Warm data tells you why, with whom, what it felt like, and what might happen next.
For example, Bateson said, a child’s test scores might indicate low performance in math, but the scores don’t explain why. “If you widen your perception — and this takes practice — you begin to see the child’s feelings about school, the culture that produces ‘math grades,’ the wider relational patterns.”
Overreliance on cold data, in any field involving people or living habitats, tends to lead to counterproductive results and lost opportunities. In schools, as special-education specialist Jennifer Yales has written in an article published by the Center for Systems Awareness at MIT, it leads to decisions about children’s futures that ignore the full range of their life stories and can track them into school plans that don’t fit their capabilities. In forest management, attention focused on the number of trees planted can ignore the question of which trees and plants are needed, given the coevolved interdependence of the diverse plants and animals in an ecosystem.
I did not encounter Bateson’s vocabulary until recently; when I did, I immediately recognized the problem she describes.
In healthcare, the cold data often masks the impact of human relationships and mutual respect — which turn out to be the most important factors in improving the quality of patient care, increasing the engagement of medical staff, and lowering costs. Quantitative information can track whether a new practice worked on a unit, but that knowledge is not sufficient to scale that practice through a hospital system. You must also know how and why it worked, the circumstances in which it might not apply, and how the caregivers felt about using it.
At University Hospitals (UH), we are learning to integrate and interpret cold and warm data as a rigorous discipline. It is dangerous to rely on either one without the other. We still use cold data extensively; we do not take stories at face value. But behind every bar graph is a story, and every story must be tested for credibility and representativeness.
Cold data can be dangerous
I began experimenting with warm data early in my career, when I was invited to give grand rounds in the department of surgery at Johns Hopkins. For an anesthesiologist and critical-care physician like me, this was a rare honor. About 100 surgeons, residents, fellows, medical students, nurses, and visiting faculty gathered to hear me talk about my research on the relationship between staffing and patient safety. In our study of intensive care units (ICUs) in Maryland, my colleagues and I found that having an ICU specialist on staff reduced death rates by about a third. If every hospital did this, it would save thousands of lives.
My argument was solidly grounded in statistical regression models. I had presented that evidence in other talks. Yet this time, when the organizers asked for my slides, I told them I didn’t have any.
“What do you mean? Everybody has slides.”
I said I didn’t need them, but they insisted, so I provided just two slides — the bare minimum — and didn’t refer to them in the talk.
I did this because something was nagging at me: a feeling that if I stuck to the numbers, people might be impressed, but nothing would change. Instead, I hoped that if others heard about physicians and nurses collaborating, and about patients healing as a result, they might feel the urgency to change the way I did.
And in fact, the effect was immediate. Compared with those at my other presentations, the questions were sharper and the arguments more honest. I realized something that day that has stayed with me ever since. When we talk about changing a system, the numbers do not tell the complete story. Change starts with the heart. That aspect of change needs to be documented in ways that go beyond the numerical data. When you bring stories to the surface, in an honest and transparent way, you open up possibilities that otherwise might not exist.
There is often resistance to using warm data. Medical professionals, in particular, are trained empiricists. We trust what we can measure, replicate, and publish. This training is enormously valuable; it is the foundation of evidence-based practice, and I have spent my career building measurement systems, run charts, and accountability structures that depend on it. In the mid-2000s, when my colleagues and I set a goal of zero central-line infections for intensive care units and campaigned to bring hospitals throughout the state of Michigan on board with the requisite new practices, the cold data — infection rates per 1,000 catheter days, tracked month by month — was essential. Without it, we could not have known whether we were making progress or fooling ourselves.
But cold data has a dangerous property. When you treat it as the whole story, it makes you self-righteous. You close your aperture. Your facts are correct, so everyone else’s facts seem irrelevant.
Darrell Huff’s famous book How to Lie with Statistics was published in 1954, and its central warning has only become more relevant: numbers can be selected, framed, and presented in ways that support almost any conclusion. The antidote to misleading statistics is not more statistics. It is context — the kind of context that comes from knowing the conditions under which the number was collected and the people whose lives it reflects. Warm data serves as a check on cold data: it forces you to ask whether the numbers are telling the whole truth or only the part of the truth that confirms what you already believe.
As chief quality officer, assigned to enforce standards, I have sometimes looked at the metrics of a low-performing department and thought, how did they let it get this bad? I’ve had to catch myself and remember that behind the numbers are colleagues who are struggling, who deserve to be understood before they are judged. If you don’t ask what the data cannot tell you — what they are experiencing, what barriers they face, what the system looks like from where they stand — you will make decisions that are technically accurate but humanly wrong. The alternative is to seek to understand people’s perspectives while still holding them responsible for results. Those two attitudes — empathy and accountability — are not in tension. They require one another.
What warm data can reveal
Cold data can also mask critical factors that keep real-world abuses in place. When I was at Johns Hopkins, a senior physician in obstetrics was discovered to have been covertly filming female patients for years. This sexual-harassment case resulted in a $190 million settlement.
My colleague Michael Armstrong, who was chair of the Johns Hopkins Medicine board, was the former CEO of AT&T, and had funded my endowed chair at the Armstrong Institute, called to ask what I thought. I told him, with all due respect, that Hopkins had missed the core diagnosis.
“The policies are necessary,” I said. “But you didn’t get to the real question: why are people afraid to speak up?” I recommended a methodology I admired, developed by Mary Dixon-Woods, a social scientist then at the University of Leicester. She had used it when investigating a National Health Service (NHS) trust safety catastrophe in England, in which nobody had spoken up to intervene when patients were harmed. The Dixon-Woods method of inquiry had three conditions: an independent team would conduct the interviews, no one at Hopkins (including me) would know who was being interviewed, and the results would be shared publicly.
That last condition was the hard one. Armstrong understood, but the dean and the lawyers were less comfortable. I argued that if we asked people about their experience of not being heard at Hopkins, and then we suppressed the findings, we would deepen the silence we were trying to break.
Dixon-Woods herself led our study. She and her team confidentially interviewed 67 people: 20 senior leaders and 47 frontline personnel. The findings, ultimately published in Academic Medicine in 2019, were devastating and transformative. The participants’ stories revealed a hierarchical culture pervaded by fearfulness at almost every level. Certain individuals — colloquially known as “untouchables” — engaged in transgressive and disruptive behavior with impunity. People did not speak up because they did not trust that anything would happen if they did. They did not feel safe, and the avenues for reporting were cumbersome.
No employee-engagement survey would have surfaced this. This was warm data — qualitative, narrative, relational — and it could only have been gathered through a process that honored the complexity of people’s experience. When Dixon-Woods presented the findings at her own Johns Hopkins grand rounds session, I received 15 further emails during the session itself from people reporting leaders who had done egregious things: bullying, sexual harassment, and other misconduct. In some cases, the misconduct had been observed for more than a decade, but the individuals were department chairs and high-revenue surgeons whom nobody had been willing to name.
We put a fair process in place, adopting a generally accepted method for investigating scientific misconduct. People who had been protected for years were removed from their positions of power. It was genuinely transformative, in the sense of changing long-established abusive practices, and it only happened because we were willing to listen to warm data.
Integrating data in practice
Cold data is easy to work with in some respects. Spreadsheets can quickly average or compare the numbers. But the numbers in themselves can be misleading. Out of necessity, I learned to find systematic ways of blending them with storylines.
Between 2003 and 2006, I led the Michigan Keystone Project, which reduced central-line infections by an average of 66 percent across 103 ICUs in 67 hospitals. Our cold data, as published in the New England Journal of Medicine, proved that interventions with the patient-safety checklist had worked. But it could not explain why they worked better in some intensive care units than in others. The five-item checklist was necessary, but it was not sufficient. Something else was happening in those ICUs that reached zero infections.
Dixon-Woods and the sociologist Charles Bosk oversaw the investigation, published in the Milbank Quarterly in 2011. Based on our team’s account of the program, they found that the Michigan project had succeeded through a combination of strategies that no purely quantitative analysis would have uncovered: the creation of a densely networked community that exerted normative pressure on its members; the reframing of catheter infections from a normal medical occurrence into a social problem; and the deliberate use of both storytelling and hard data to overcome resistance.
Both storytelling and hard data. Not one or the other. The cold data provided the accountability — the ranked infection rates that made performance visible and created a disciplinary force. The warm data provided the meaning — the stories of patients harmed, the narratives of ICUs that had reached zero, and the sense of shared purpose that made people want to be part of something larger than compliance. The stories without the infection rates would have been inspirational but unmeasurable. It was the combination that saved lives.
There is an epistemological change involved here that I think physicians need to confront honestly. In medicine, we are trained in book wisdom — the knowledge that comes from evidence, published studies, and the technical mastery of diagnosis and treatment. There is another kind of knowing: experiential wisdom, the knowledge that comes from living with a disease, or caring for someone who has it, or working inside a system every day and feeling its failures in your body.
A nurse may not have published a study on catheter infections, but she has watched patients die of them, and she knows which protocols are followed and which are quietly ignored and why. A patient’s family may not understand the physiology of sepsis, but they know that their child is thirsty and that no one is listening. A physician may not have studied the relationships between socioeconomic status and health, but it’s evident from day-to-day experience in the emergency department that people who struggle to care for their children are also more vulnerable to disease.
Advocates of cold data raise many reasons to favor it. They see personal stories as biased — unrepresentative, unreliable, and difficult to judge. If by bias we mean that a person’s worldview may not match that of the broader population, that is correct. But if we mean that a person’s story does not reflect their lived reality, we are wrong. The story reflects their reality. The question is whether we have the methods and the will to assess it accurately.
Warm data is seen as too vague, time-consuming, and difficult for scientists to evaluate and verify. Yet most physicians receive little or no training in the methods of social science, and so they barely recognize that rigorous methods exist for establishing the validity of qualitative findings. Thematic analysis identifies recurring patterns across multiple interviews or observations. Grounded theory builds explanatory frameworks from the data itself, rather than imposing a hypothesis and looking for confirmation. Ethnographic observation places a trained observer inside the system being studied — in a ward, an ICU, or a primary-care office — to document what actually happens, as distinct from what people say happens. Member checking takes findings back to the people who were studied and asks whether the interpretation rings true. Triangulation compares findings from different sources, different methods, and different observers to see whether they converge.
These methods do for warm data what statistical testing does for cold data. They do not make stories into numbers; they make stories accountable. They help us check: Are we cherry-picking the voices we highlight? Are the patterns we identify robust across multiple informants? Could someone with a different perspective replicate our interpretation? The accountability is different in kind from statistical significance, but it is accountability nonetheless.
The Hopkins voice study was itself an exercise in this kind of rigor. Dixon-Woods did not simply ask people whether they felt safe and report the answers. She used independent investigators with no institutional loyalties. She insisted on consistent interview protocols, systematic coding of themes, and public sharing of the findings so they could be challenged. The result was warm data that could withstand scrutiny — and that no one at Hopkins could dismiss as mere anecdote, because the methodology was as disciplined as any clinical trial.
Seeing the faces behind the numbers
The practical question for any healthcare organization is how to build these methods into daily operations, not just into research studies. At UH, we do not ask clinicians to become ethnographers. Our approach is called “Believe, Belong, Build.” We invite professionals to recognize their ability to exercise judgment (believe) and to regularly talk about what they are finding and why it matters (belong).
As for build, that means creating systems that make a routine out of integrating warm and cold data. For instance, our collaborative-care program, through which we treat depression and other psychological challenges, uses a standard nine-question evaluation instrument called the PHQ-9 to screen for patients who need this support.
But we don’t trust that cold data in itself. A behavioral-health coordinator embedded in the primary-care office builds a relationship with the patient, listens to their story, and integrates what the coordinator learns into the treatment plan. The program’s registry tracks outcomes — Are patients engaged? Are their scores improving? — and integrates both kinds of data. Our results — recovery rates climbing year over year, referral patterns improving, and patients who were once resistant now engaged in treatment — are measurable precisely because the unmeasurable was included.
When I look at data now — a performance dashboard, a quality metric, or an outcome report — I practice something that I can best describe as seeing the faces behind the numbers. I look at those who are improving and those who are not. I dive into the individual data elements and try to understand what’s going on with each person involved. This is not a technique. It is a habit of mind, something I have had to cultivate deliberately because my training taught me to do the opposite.
It is a collaborative habit as well. Every week, in our Illuminators meetings at University Hospitals, we practice operating from this perspective. A dietitian describes the months she spent listening to a patient who refused medication changes, and the room hears what no dashboard could have shown: that the patient’s resistance was not ignorance but self-protection, and that the path to better outcomes ran through trust, not compliance. A pharmacy director presents a new transitions-of-care role, and a rehab team listening in realizes that its patients can’t open their pill bottles or read the labels — a barrier invisible to every metric in the system, solved within weeks by stocking easy-open containers and magnifying glasses.
The Illuminators presentations are booked long in advance and last an hour. Presenters generally show slides. The data matters, but what moves people to change their practice are the narratives — and the discipline of holding the two together, never letting the story excuse a bad number and never letting a good number substitute for a missing story.
We have not fully solved the problem of integrating cold and warm data; we are in the early stages of understanding how to do it well. But we have learned this much: every time we treat cold data as the whole truth, we make ourselves prone to one of the most consistent errors in the use of numbers — seeing only what we expect to see and calling it evidence. Many organizations today, in healthcare and other fields, are reorienting themselves toward more human goals. As they do, the mix of warm and cold data is a primary source of continuous learning.
Notes
Nora Bateson distinguishes between cold and warm data: Nadine Maarhuis, “How Our Ways of Knowing Shape Our Collective Future,” interview with Nora Bateson, Re-Generation, April 8, 2026.
In schools, cold data leads to decisions about children’s futures: Jennifer Yales, “Humanizing the Data: A Path to More Compassionate Systems for IEPs and Other Narratives,” Center for Systems Awareness, Stories from the Field, Spring 2022.
In our study of intensive care units in Maryland: Peter J. Pronovost, Derek C. Angus, Todd Dorman, et al., “Physician Staffing Patterns and Clinical Outcomes in Critically Ill Patients: A Systematic Review,” JAMA 288, no. 17 (2002): 2151–2162.
In the mid-2000s, we campaigned to bring hospitals throughout Michigan on board: Peter Pronovost, Dale Needham, Sean Berenholtz, et al., “An Intervention to Decrease Catheter-Related Bloodstream Infections in the ICU,” New England Journal of Medicine 355, no. 26 (2006): 2725–2732.
Darrell Huff’s central warning: Darrell Huff, How to Lie with Statistics (New York: W. W. Norton, 1954).
A senior physician in obstetrics was discovered to have been covertly filming female patients: Trip Gabriel, “Hospital Agrees to Pay $190 Million Over Recording of Pelvic Exams.” The New York Times, July 21, 2014.
I recommended a methodology I admired: Mary Dixon-Woods, Richard Baker, Kathryn Charles, et al., “Culture and Behaviour in the English National Health Service: Overview of Lessons from a Large Multimethod Study.” BMJ Quality & Safety 23, no. 2 (2014): 106–115.
Mary Dixon-Woods herself led our study. The findings were devastating and transformative: Mary Dixon-Woods, Anne Campbell, Graham Martin, et al., “Improving Employee Voice About Transgressive or Disruptive Behavior: A Case Study,” Academic Medicine 94, no. 4 (April 2019): 579–585.
Mary Dixon-Woods and the sociologist Charles Bosk oversaw the investigation: Mary Dixon-Woods, Charles L. Bosk, Emma Louise Aveling, Christine A. Goeschel, and Peter J. Pronovost, “Explaining Michigan: Developing an Ex Post Theory of a Quality Improvement Program,” The Milbank Quarterly 89, no. 2 (2011): 167–205.
A standard nine-question evaluation instrument: The PHQ-9 (Patient Health Questionnaire-9) was developed by Robert L. Spitzer, Janet B. W. Williams, and Kurt Kroenke. See Kroenke, Spitzer, and Williams, “The PHQ-9: Validity of a Brief Depression Severity Measure,” Journal of General Internal Medicine 16, no. 9 (2001): 606–613.
The Illuminators is a reader-supported publication. To receive new posts and support my work, consider becoming a free or paid subscriber.